 Lotus Institute


News
Lotus Institute

MARKET ANALYSIS APRIL 02: GOLD CONTINUES BULLISH MOMENTUM, VN-INDEX RECOVERS STRONGLY
MARKET OVERVIEW Release time: 10:00 AM, April 02, 2026 Publisher: Mr. Leon
1. Stock Market: Vietnam Market: VN-Index had a very sharp V-shaped recovery from the bottom, breaking the previous short-term bearish structure and successfully breaking out above the moving average cluster. However, after a series of steep bullish candles, the price shows signs of stalling with a bearish correction candle. The fact that the price has moved too far from the EMA cluster will certainly trigger T+ profit-taking pressure. The momentum indicator has touched the overbought ceiling (above 80) and is beginning to cross downward. A pullback phenomenon is entirely logical after a hot uptrend, so you should not FOMO chase at this suspended price zone. It is necessary to patiently wait for the price to successfully retest and create an accumulation base on the EMA band to find a safe disbursement point with a good R:R ratio. US Market: Price structure: US100 is presenting a decisive picture of a downtrend. The price is plummeting sharply, continuously creating lower highs/lows and trading around the $23,109 mark. The distance between the price and the MA cluster (red ribbon) is widening, and the MA expands its downward cutting angle. Momentum: Stochastic dives straight into the deep oversold mark (below 20). However, the downward momentum is currently very large.
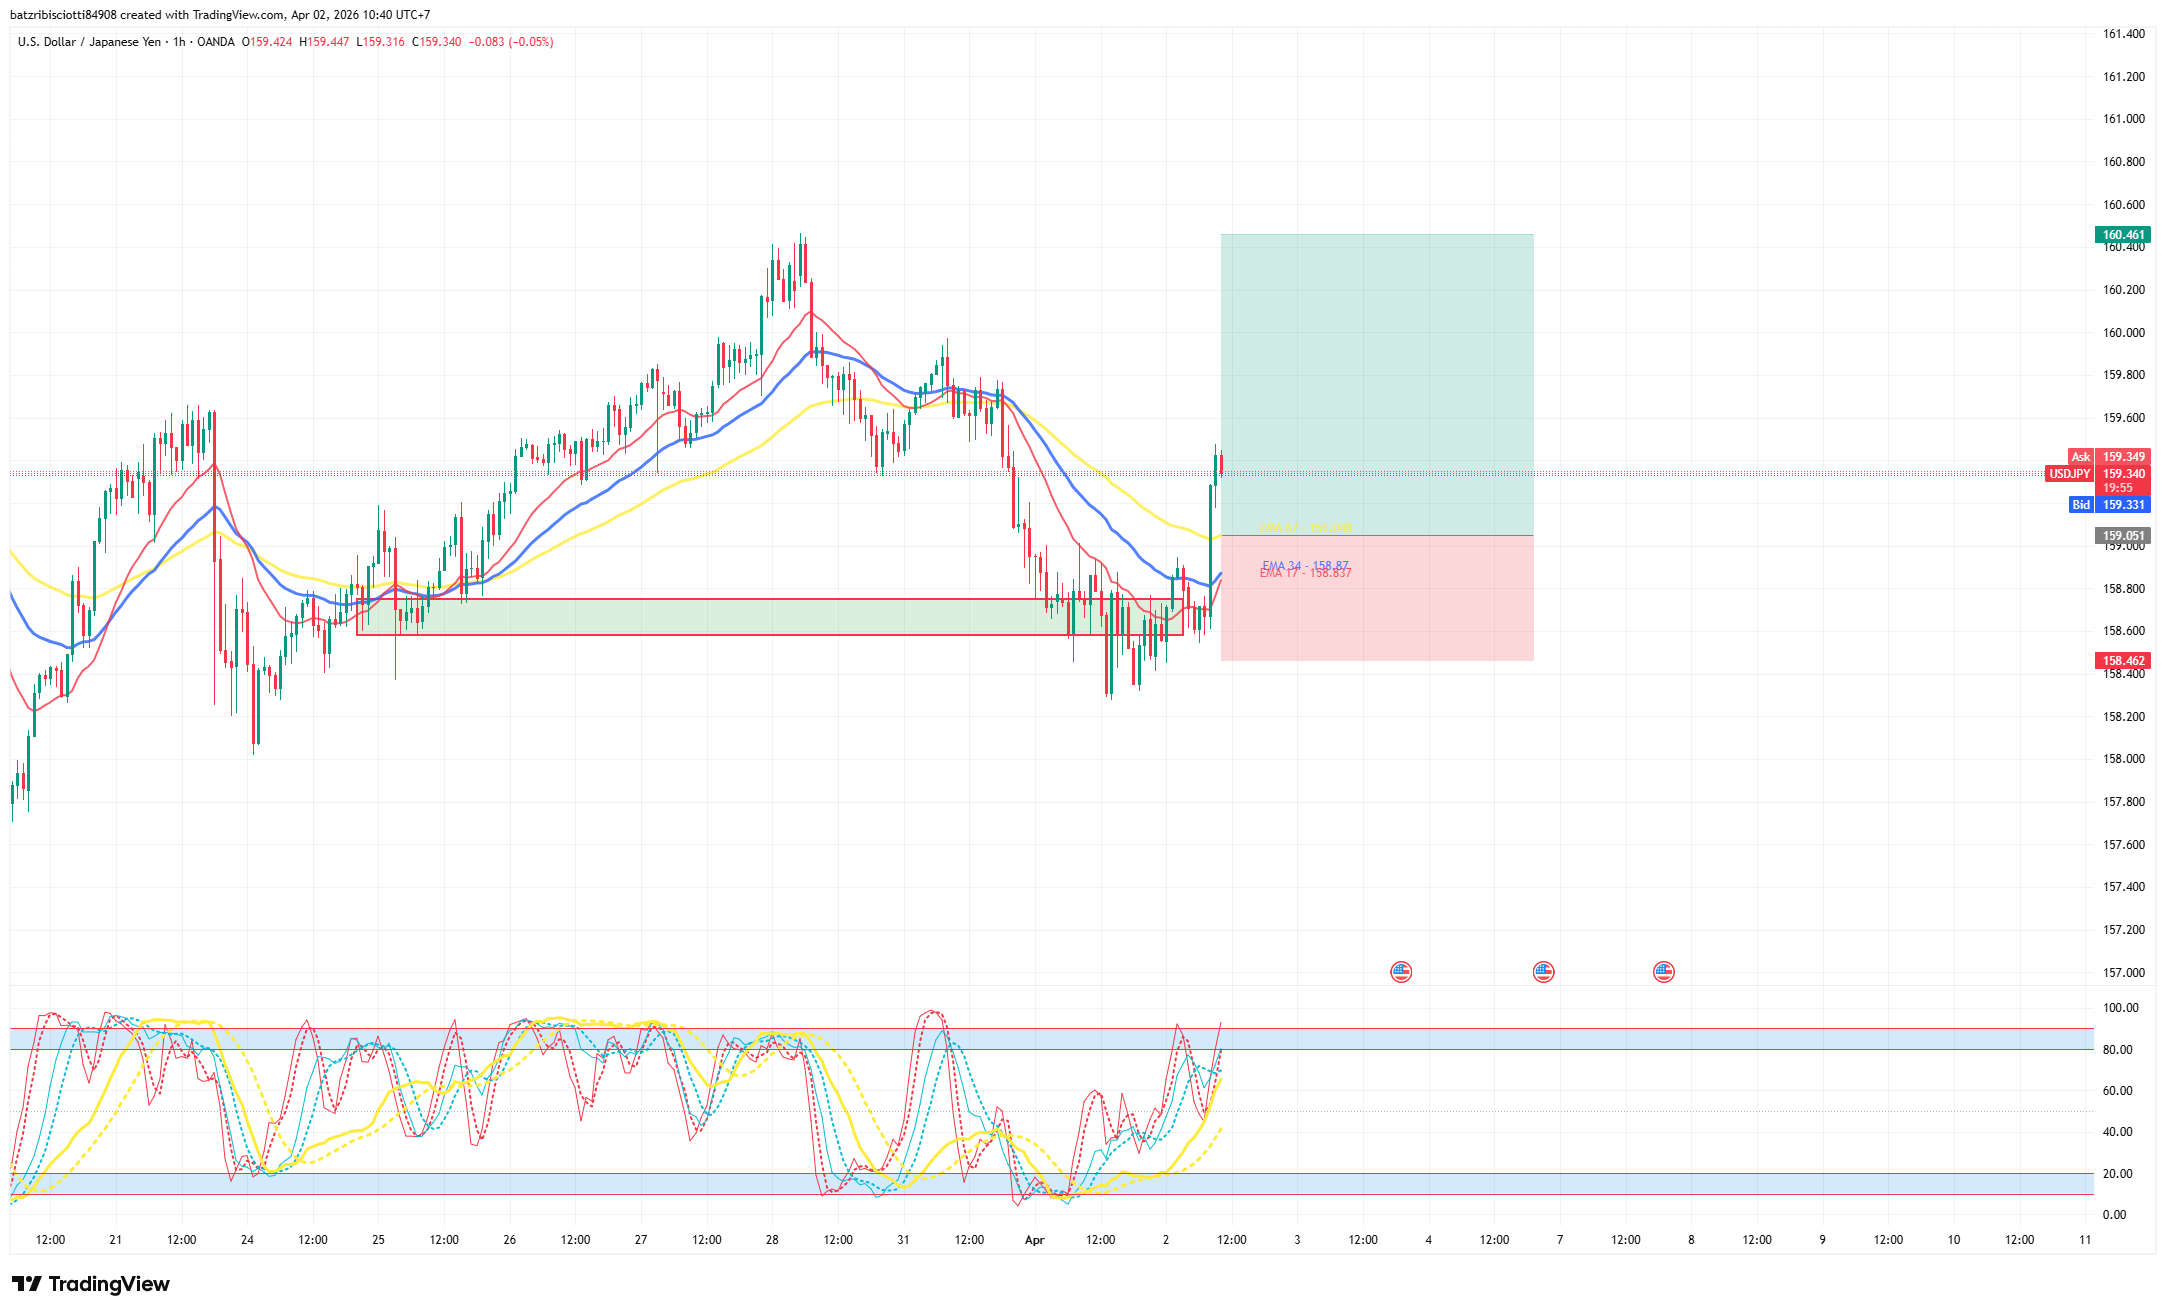
2. Foreign Exchange: The market is undergoing a Change of Character as GU has officially lost its short-term bullish price channel. The price has decisively broken down below the upward-sloping blue support Trendline. At the same time, the price also pierced through and closed below the entire EMA cluster. Short-term EMAs are showing signs of crossing downward, combined with the oscillator pointing towards the oversold zone, signaling that the trend could reverse to bearish. You should wait for a recovery rhythm (Retest) to check the newly broken Trendline (now acting as resistance) or the EMA cluster to find a Short setup in alignment with the breakout structure.
3. Gold: The Bullish trend is taking absolute dominance. After a deep plunge forming a V-shaped bottom, Gold recovered strongly and established a structure of higher highs and higher lows. The price just had a healthy Pullback, touching exactly the dynamic support confluence zone of EMA 17 and EMA 34. Immediately, the Buyers stepped in to push the price back up with decisive green candle bodies. The EMA cluster is flaring widely upward, confirming a sustainable uptrend, while the bottom oscillator also curves up from the neutral zone, indicating remaining bullish room. The current strategy is to continue prioritizing Buy on dips. Retests of the short-term EMA cluster will be optimal entry points; you should avoid counter-trend trading at this time.
4. Oil: The Oil chart lacks a clear trend and is in a strongly Choppy market state. A candle with an extremely long upper shadow (Spike) appeared, sweeping liquidity, indicating a False Breakout before the price was immediately pushed back down. Currently, the candle bodies are fluctuating within a narrow range and are trapped between the tightly twisted, horizontal EMAs. The signal lines of the oscillator are also interwoven without providing a clear direction. The most logical approach right now is to stand aside and observe. Trading in a sideways price zone with such large shadow-sweeping amplitude carries a very high risk of hitting Stoploss. It is necessary to wait for Oil to finish accumulating and confirm a clear breakout trend from the EMA cluster before taking action.
5. Bitcoin: The Downtrend structure is still completely controlling the situation, with the blue diagonal Trendline acting as an extremely highly regarded dynamic resistance. The chart recorded a very strong price Rejection. When BTC recovered and touched the confluence between the diagonal Trendline and the EMA 67 band, a massive selling force emerged, printing a long-bodied red candle piercing through the nearest short-term support levels. The momentum indicator just crossed downward from the overbought zone, in phase with the price's dumping rhythm, showing that the Sellers are in full control. You should prioritize Sell on Rallies at resistance zones. This structure will only be invalidated if BTC has a massive Volume Breakout that completely surpasses the diagonal Trendline.
RECOMMENDATION:
-
USD/JPY: Entry: 159.051. Stop Loss: 158.462. Take Profit: 160.461.
NOTABLE EVENTS TODAY:
DISCLAIMER: The above analysis solely represents the personal views of Lotus analyst Leon and does not constitute a basis for actual market participation. Lotus only provides technical trading analysis and trading knowledge training for students. Lotus does not represent any securities company or asset management firm. Lotus does not manage funds on behalf of students.


_-25-03-2026-09-18-53.png "VN-INDEX GIẰNG CO DƯỚI 1.730 ĐIỂM - VÀNG & EUR/USD TIẾP TỤC SUY YẾU: CHIẾN LƯỢC 25/03")