 Lotus Institute


News
Lotus Institute

Market News Jan 30: Gold "Trend Break" after Blow-off Top – Bitcoin Crashes from Bull Trap.
Release Time: 10:00, January 30, 2026 Issuer: Mr. Loki
MARKET OVERVIEW
1. Stock Market:
-
Vietnam Stock Market: The market is finding solid support at the 1,800-point level and showing signs of a slight recovery. Liquidity decreased compared to the previous session, indicating that selling pressure has temporarily cooled down after a sharp drop. The 1,800-point zone, also the lower boundary of the short-term uptrend channel, is acting as effective support. A short-term rebound may emerge from here; however, the recovery pace is expected to be limited as the index has yet to re-establish a balance after losing the MA(20) and is currently testing supply-demand around 1,800–1,840 before clearer signals emerge.
-
US Market: In the January 28 session, Wall Street fluctuated sharply as the Fed kept interest rates unchanged. The S&P 500 briefly crossed the 7,000 mark during the session but closed slightly lower at 6,978 (down ~0.01%). The Dow Jones edged up ~0.02% to ~49,015, and the Nasdaq Composite rose ~0.17% to ~23,857. This reflects continued buying power in tech and chip sectors, although the overall market remains cautious and moves sideways near historic highs while waiting for earnings results and clearer policy signals.
2. Foreign Exchange (Forex):
-
AUD/USD: Primary trend is bullish. Daily resistance: 0.70500; Daily support: 0.69700. Consider a Long (Buy) position if the price breaks above the daily resistance.
-
USD/CHF: Primary trend is sideways. Daily resistance: 0.77700; Daily support: 0.76400. Consider a Long (Buy) position if the price breaks above the daily resistance.
3. Gold:
-
Development: After hitting a new record high (approaching $5,600 on the chart), Gold suddenly reversed and plummeted. Prices fell vertically, breaking through multiple supports to trade around $5,187.
-
Structure: This is a classic "Blow-off Top" pattern, often appearing at the end of a hyper-growth cycle. Panic selling is intense, creating long-bodied red candles. The short-term bullish structure has been severely damaged.
4. Oil:
-
XTI/USD: Primary trend is bullish. Daily resistance: 65.90; Daily support: 64.10. Consider a Short (Sell) position if the price breaks below the daily support.
5. Bitcoin:
-
Development: Yesterday's breakout of $90k proved to be a classic "Bull Trap." After luring a large number of buyers to the peak, whales sold off aggressively, pushing BTC from above $90k down to a low of $81,577.
-
Structure: Price has broken all key support levels ($88k, $85k) and is in freefall searching for a new bottom. Successive long red candles indicate extreme market panic. This is a brutal "game reset."
RECOMMENDATION:
USD/CHF Buy Stop: 0.77200Stop Loss: 0.76300Take Profit: 0.78900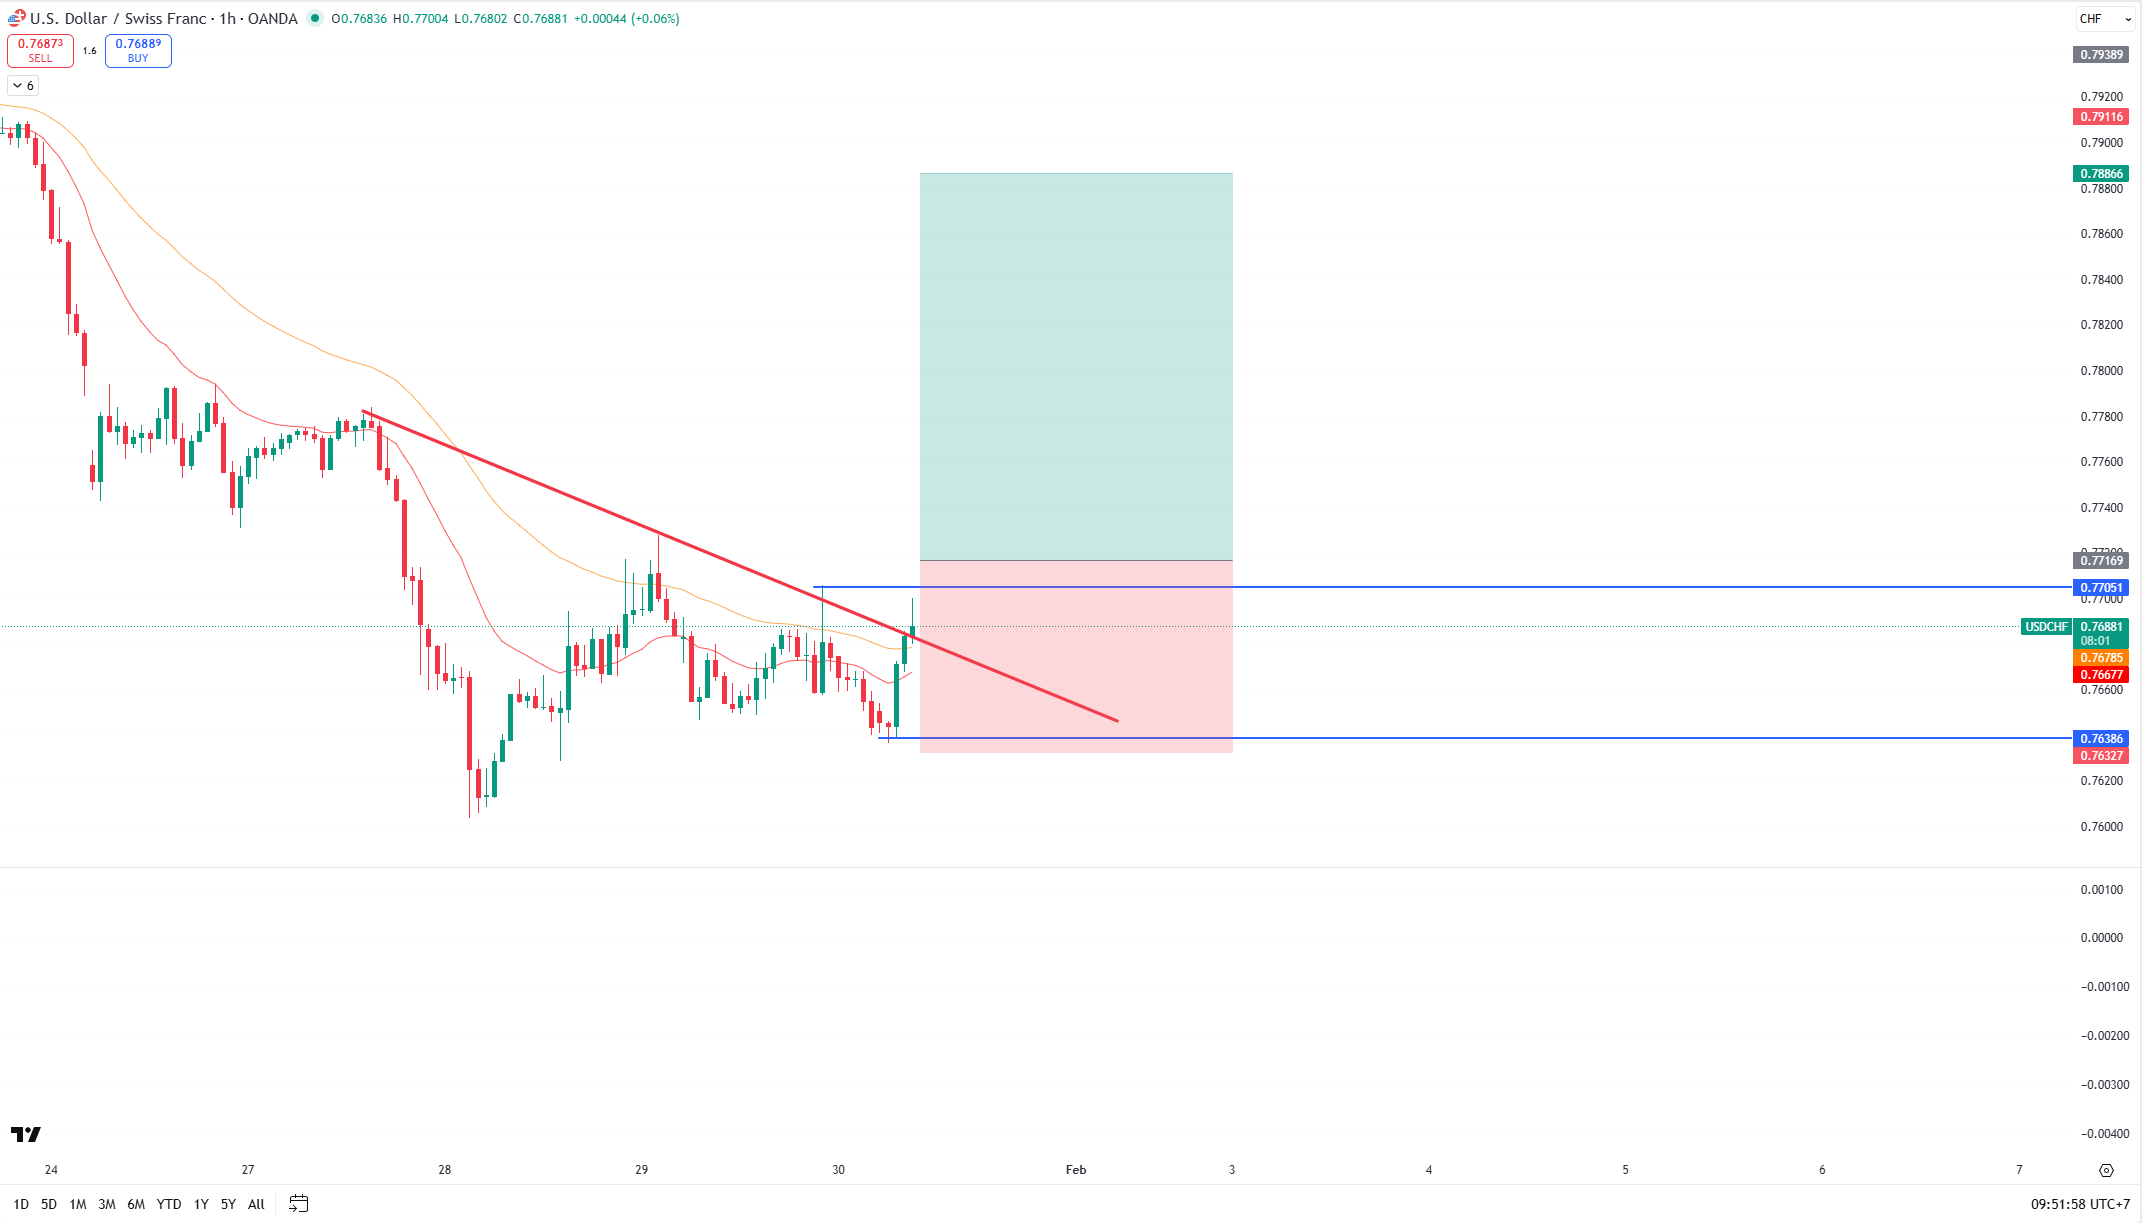
TODAY'S KEY EVENTS:
-
04:00 AM | USD: US Treasury Currency Report
-
04:30 AM | USD: President Trump Speaks
-
08:30 PM | USD: Core PPI m/m (Forecast: 0.2% | Previous: 0.0%)
-
08:30 PM | USD: PPI m/m (Forecast: 0.2% | Previous: 0.2%)
DISCLAIMER
-
The above analysis represents only the personal views of analyst Loki from Lotus and is not a basis for actual market participation.
-
Lotus only provides technical analysis and trading education for students.
-
Lotus does not represent any securities company or asset management firm.
-
Lotus does not manage funds for students.

")


