 Lotus Institute


News
Lotus Institute

OIL MAKES A TURNING POINT BREAKOUT - GOLD & US100 PLUNGE PARABOLICALLY: TRADING STRATEGY MAR 20
MARKET OVERVIEW
Release Time: 10:00, March 20, 2026 Issuer: Mr. Leon
1. Stock Market:
-
Vietnam Market:
-
Price Structure: VN-Index is in a rather negative corrective structure. The index had a recovery phase following the plunge but immediately weakened and is heading back down to the 1,858 level. The critical point is that the price has pierced back down through the downward-sloping MA support cluster (the red ribbon).
-
Momentum: Notably, the Stochastic indicator, after hitting the overbought zone, has sharply angled downwards and is plunging straight to the bottom.
-
-
US Market (US100):
-
Price Structure: US100 is painting a definitive picture of a downtrend. The price is plunging heavily, continuously creating lower highs and lower lows, and is trading around the $23,109 mark. The gap between the price and the MA cluster (red ribbon) is widening, with the MA expanding its downward crossing angle.
-
Momentum: The Stochastic indicator is diving straight into the deep oversold zone (below 20). However, the downward momentum remains massive.
-
2. Forex:
-
GBP/USD: Dominant trend is Bearish. Daily resistance: 1.13400; Daily support: 1.33000. Consider Short positions when the price breaks the daily support zone.
-
USD/CHF: Dominant trend is Bullish. Daily resistance: 0.78400; Daily support: 0.77800. Consider Long positions when the price breaks the daily resistance zone.
3. Gold:
-
Price Structure: Gold is in an extreme Parabolic Downtrend, mirroring the price action of US100. The chart records a plunging red candle that broke the nearest supports, currently trading around the $5,188 mark. The price is in a free fall, far away from the MA cluster.
-
Momentum: The signal lines of the Triple Stochastic are firmly anchored at the extreme oversold bottom (near the 0 mark).
4. Oil:
-
Price Structure: The Oil chart today marks a "turning point". After a "Wash-out" plunge to the old bottom, the price quickly snapped back up decisively and officially made a Breakout from the slow MA resistance cluster (red ribbon), currently trading around the $82.352 mark. The fact that the price maintains its structure above the MAs confirms that Buyers have taken control in the short term.
-
Momentum: The Triple Stochastic indicator is "glued" to the ceiling of the extreme overbought zone (above the 80 threshold). In such a violent Breakout structure, the overbought Stochastic merely confirms that the Bullish Momentum is at its peak.
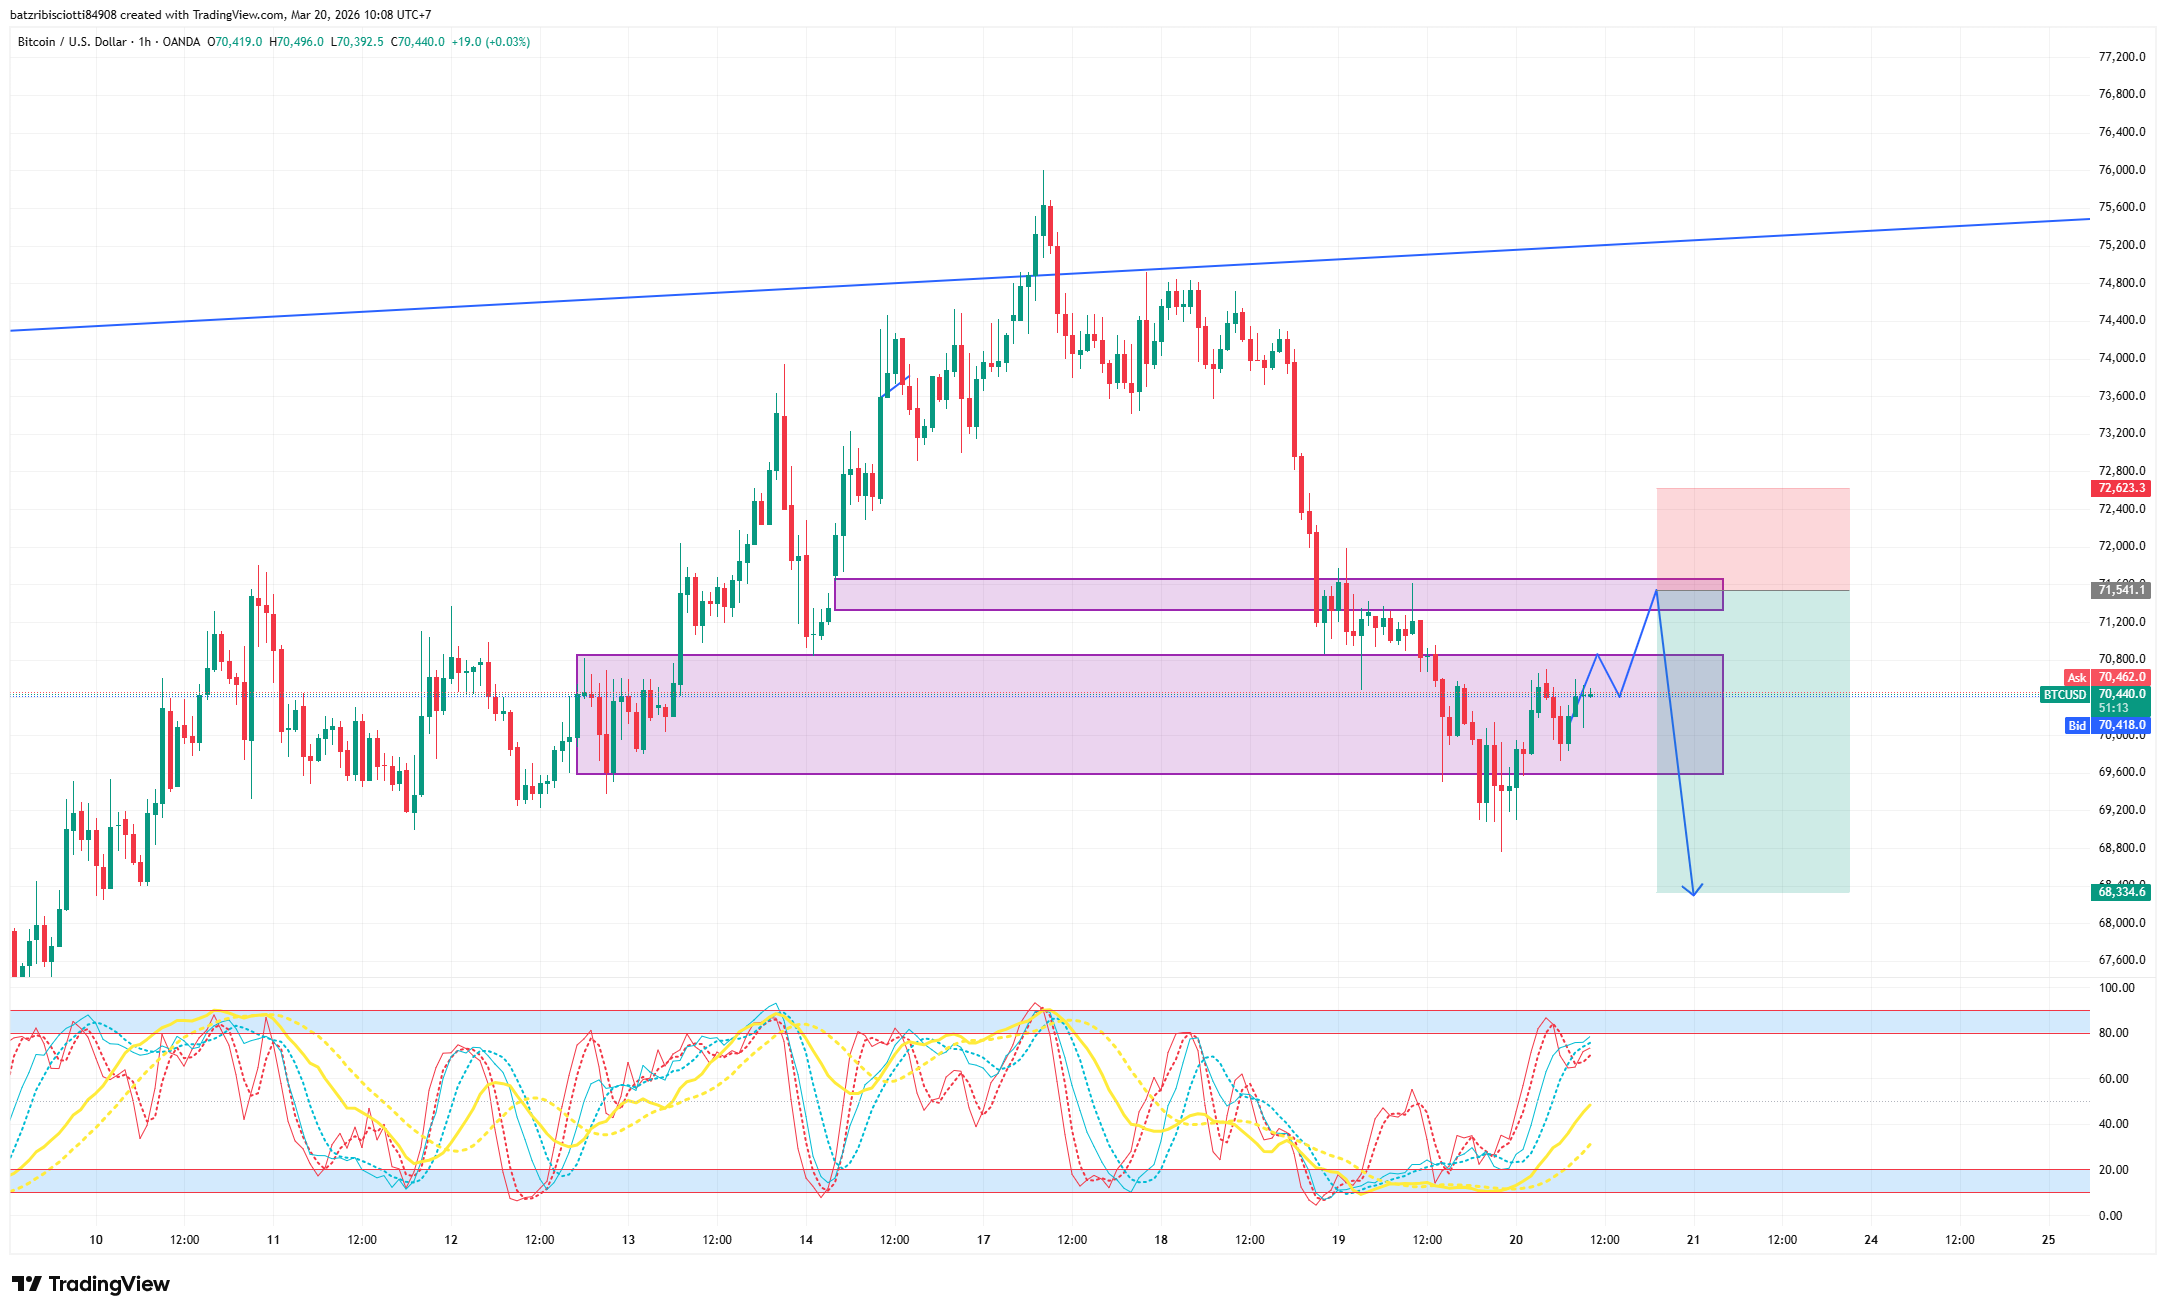
5. Bitcoin:
-
Price Structure: In stark contrast to the heat of the other four assets, BTC is resiliently holding its ground at the peak. The price is undergoing complex sideways Consolidation around the $73,088 mark, neither breaking out nor breaking the MA structure (the horizontal red ribbon).
-
Momentum: Stochastic has sharply pulled back up into the extreme overbought zone (above 80), indicating that short-term momentum is still pushing the price higher, attempting to absorb the supply.
RECOMMENDATIONS:
1. BTC:
-
Sell: 71,541
-
Stop Loss: 72,623
-
Take Profit: 68,334
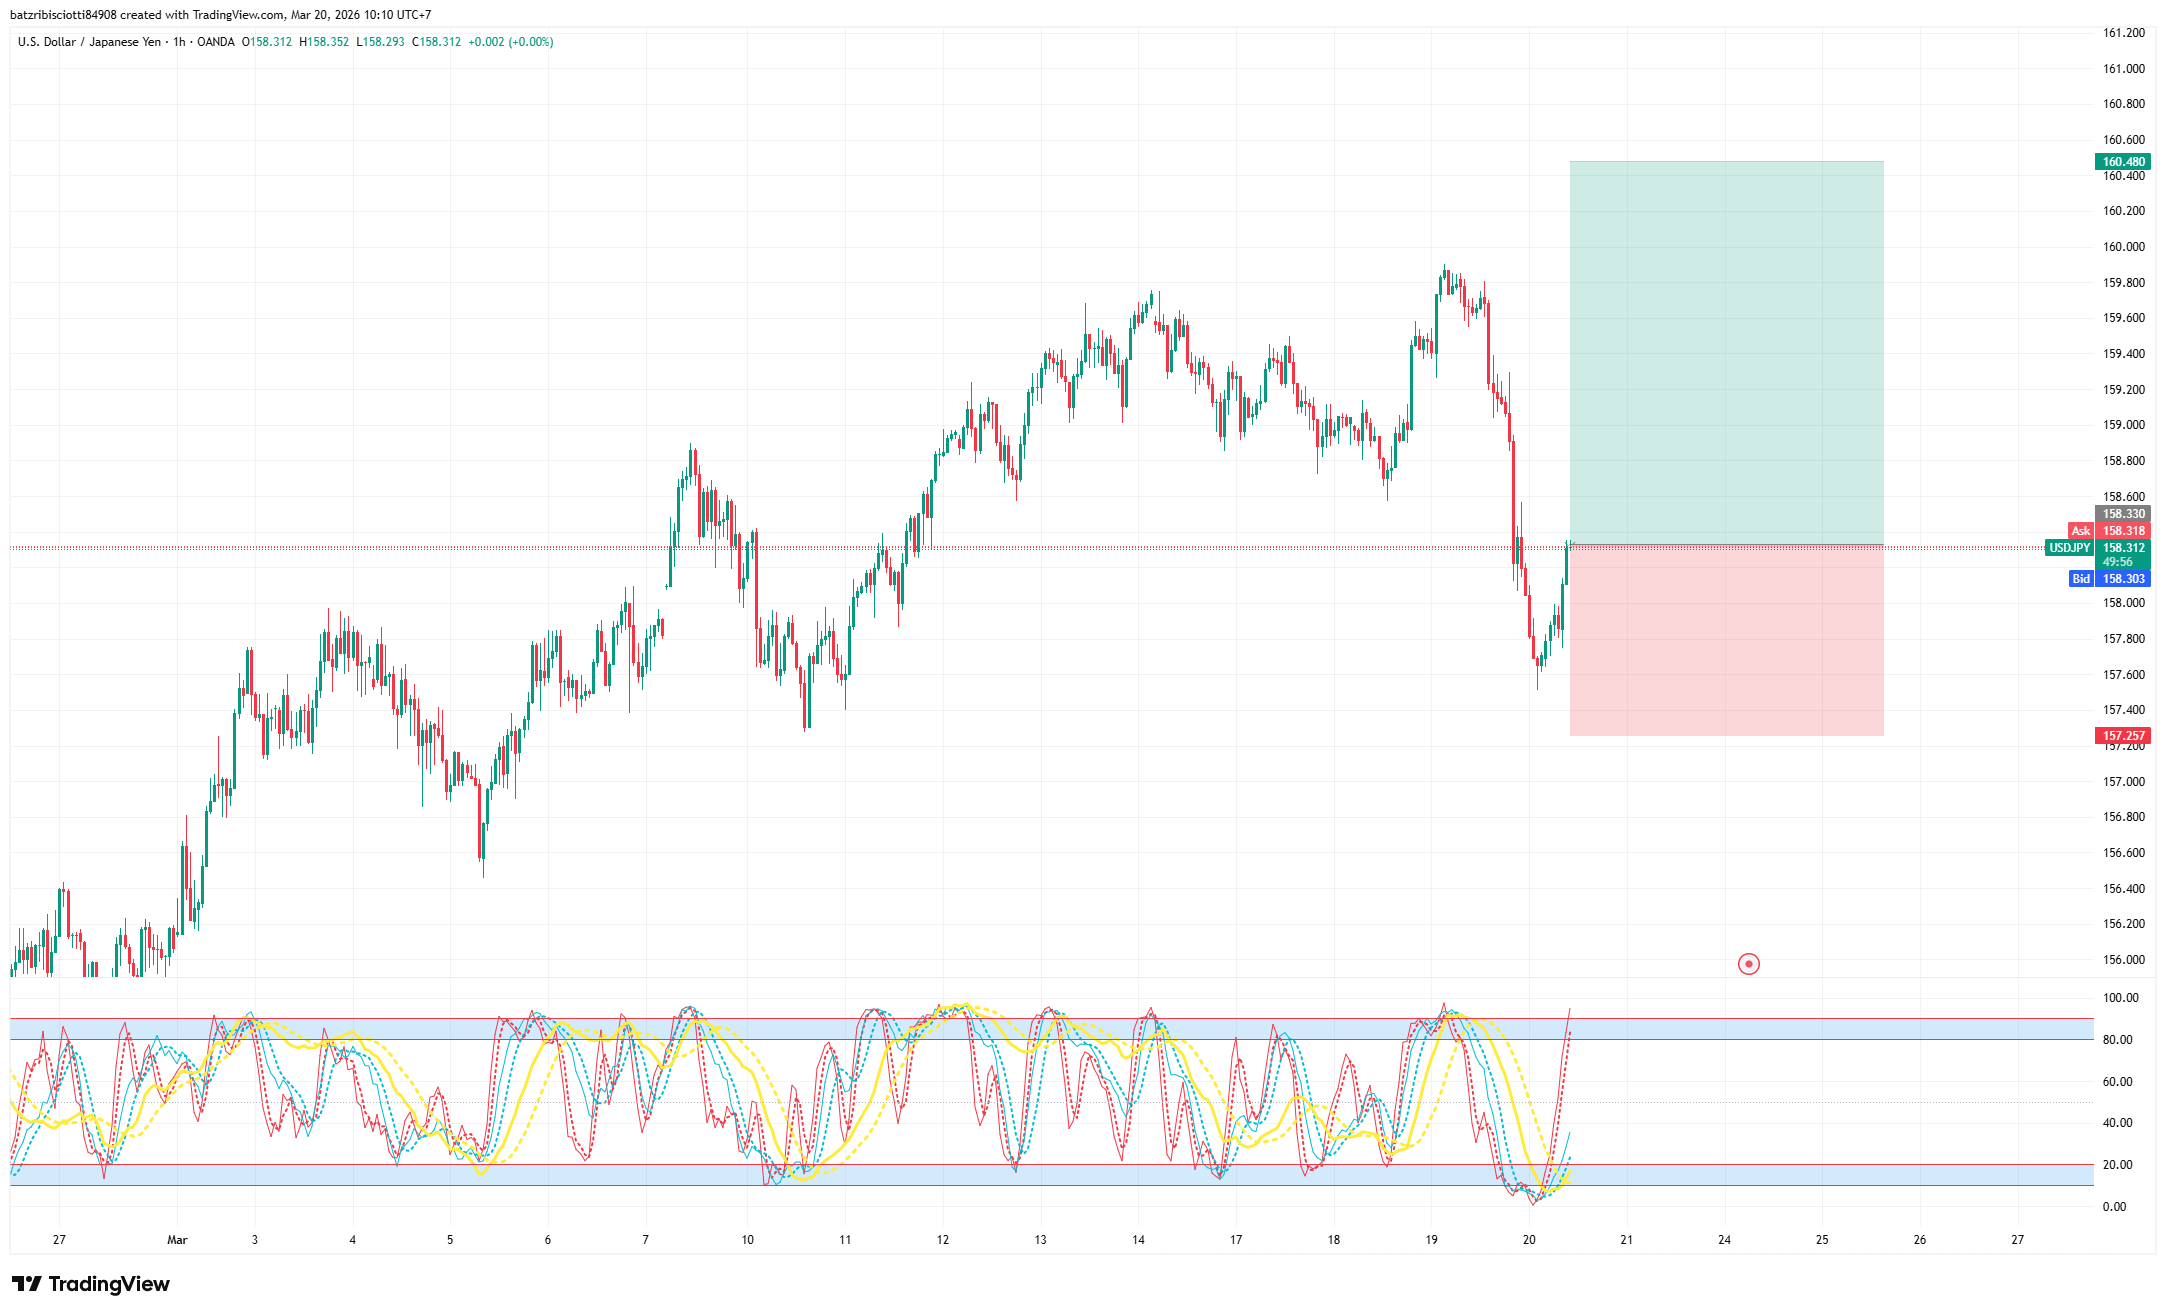
2. USD/JPY:
-
Buy: 158.330
-
Stop Loss: 157.257
-
Take Profit: 160.480
NOTABLE EVENTS TODAY: No significant news.
DISCLAIMER:
-
The above analysis represents the personal views of analyst Leon from Lotus and does not constitute a basis for actual market participation.
-
Lotus only provides technical trading analysis and trading knowledge training for students.
-
Lotus does not represent any securities company or asset management firm.
-
Lotus does not accept capital management for students.


")

