 Lotus Institute


News
Lotus Institute

Pressure at Key Resistance Levels: Markets Await New Signals at the Start of the Year
Release Time: 10:00 – January 2, 2026
Issued by: Ms. Jenny
MARKET OVERVIEW
1. Stock Market
Vietnam Stock Market:
Although a brief intraday correction occurred, the market was quickly supported and maintained its recovery trend. Low liquidity indicates that selling pressure remains limited while capital flows stay cautious. The rebound is pushing the market closer to the key resistance zone of 1,750–1,800 points, which marked a short-term peak over the past few months. In this area, supply is expected to increase and create strong price contention with buying demand, with supply–demand dynamics playing a decisive role in determining the market’s next direction.
U.S. Stock Market:
In the final trading session of 2025, Wall Street saw a mild pullback amid thin holiday liquidity. The S&P 500 declined about 0.7% to ~6,845.5 points, the Dow Jones Industrial Average fell roughly 0.6% to ~48,063.3 points, and the Nasdaq Composite slipped around 0.8% to ~23,242 points. However, on a full-year basis, major indices still posted impressive double-digit gains—S&P 500 up ~16.4%, Nasdaq up ~20.4%, and Dow Jones up ~13%—reflecting a constructive long-term outlook supported by technology stocks and the AI investment theme.
2. Forex
-
USD/CAD: The primary trend remains bullish. Daily resistance is at 1.37300, while daily support is at 1.37000. A long position may be considered if price breaks above the daily resistance level.
-
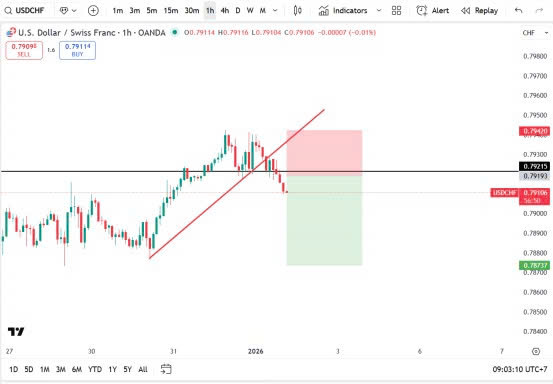
USD/CHF: The primary trend is bearish. Daily resistance stands at 0.79400, with daily support at 0.79000. A short position may be considered if price breaks below the daily support.
3. Gold:
Gold has delivered a strong breakout, successfully breaking above the descending trendline (blue line) that had capped prices for an extended period. The metal is currently trading around $4,345.
4. Oil:
XTI/USD remains in an uptrend. Daily resistance is at 57.80, while daily support is at 57.30. A long position may be considered if price breaks above the daily resistance.
5. Crypto – BTC:
BTC is making efforts to sustain its recovery and hold firmly above the $88,300 level following recent volatility. Price is receiving solid support from the EMA 53 (yellow line) near $88,234. Trading above key EMA lines suggests that buyers remain in control in the short term.
TRADE PLAN
USD/CHF
-
Sell Limit: 0.79200
-
Stop Loss: 0.79400
-
Take Profit: 0.78700
KEY EVENTS TODAY
-
14:00 – GBP – Nationwide House Price Index (m/m)
-
15:15 – EUR – Spanish Manufacturing PMI
-
15:45 – EUR – Italian Manufacturing PMI
-
15:50 – EUR – French Final Manufacturing PMI
-
15:55 – EUR – German Final Manufacturing PMI
DISCLAIMER
-
The above analysis represents the personal views of analyst Jenny from Lotus and does not constitute a basis for actual trading decisions.
-
Lotus provides technical analysis and trading education only.
-
Lotus does not represent any securities firm or asset management company.
-
Lotus does not manage client or student funds.

")


