 Lotus Institute


News
Lotus Institute

Rising Correction Pressure: Markets Await a Balance Point, Crypto Faces Elevated Risk
Release Time: 10:00 – December 16, 2025
Issued by: Ms. Jenny
MARKET OVERVIEW
1. Stock Market
Vietnam Stock Market:
The recovery attempt during the session was not sustained as the market remains in a cautious state, reflected by declining liquidity and sidelined capital flows. The MA100 is currently providing technical support after the sharp sell-off, but it has not yet generated sufficient momentum for a clear recovery, suggesting that the short-term oversold condition may persist. In a negative scenario, the market could remain under pressure and retreat toward the 1,610-point support zone, which previously supported a rebound in November 2025. However, if this level holds, the market may regain strength and re-test the MA100 support in the coming sessions.
U.S. Stock Market:
In the December 15 session, U.S. equities traded sideways with mild declines as investors remained cautious ahead of upcoming economic data releases. The S&P 500 fell approximately 0.2% to around 6,816.5 points, the Dow Jones Industrial Average slipped about 0.1% to 48,416.6 points, while the Nasdaq Composite dropped roughly 0.6% to 23,057.4 points. The pullback was driven by volatility in technology stocks and a wait-and-see sentiment ahead of labor market and inflation reports.
2. Forex
-
AUD/USD: The primary trend is sideways. Daily resistance is at 0.66300, while daily support is at 0.66200. A long position may be considered if price breaks above the daily resistance zone.
-
USD/CHF: The primary trend remains bearish. Daily resistance is at 0.79800, and daily support is at 0.79300. A short position may be considered if price breaks below the daily support level.
3. Gold:
After correcting from its recent peak, gold is moving sideways around the $4,310 level. A positive signal is that price has found strong support at the EMA 50 (yellow line) near $4,301. The Stochastic indicator is turning upward from low levels, indicating that buyers are attempting to defend this area in preparation for a potential rebound.
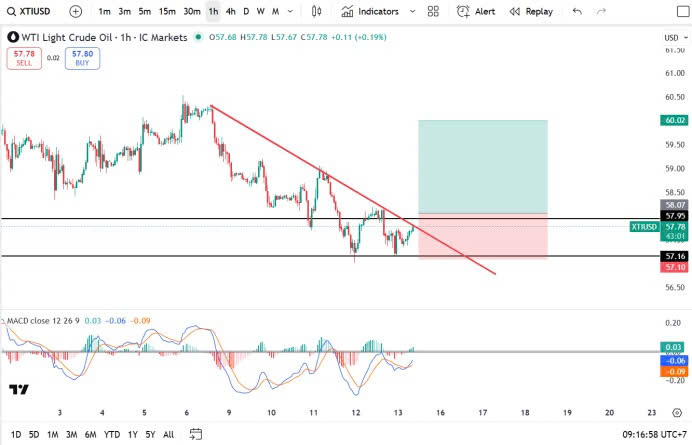
4. Oil:
XTI/USD remains in a downtrend. Daily resistance is at 57.20, while daily support is at 56.50. A short position may be considered if price breaks below the daily support.
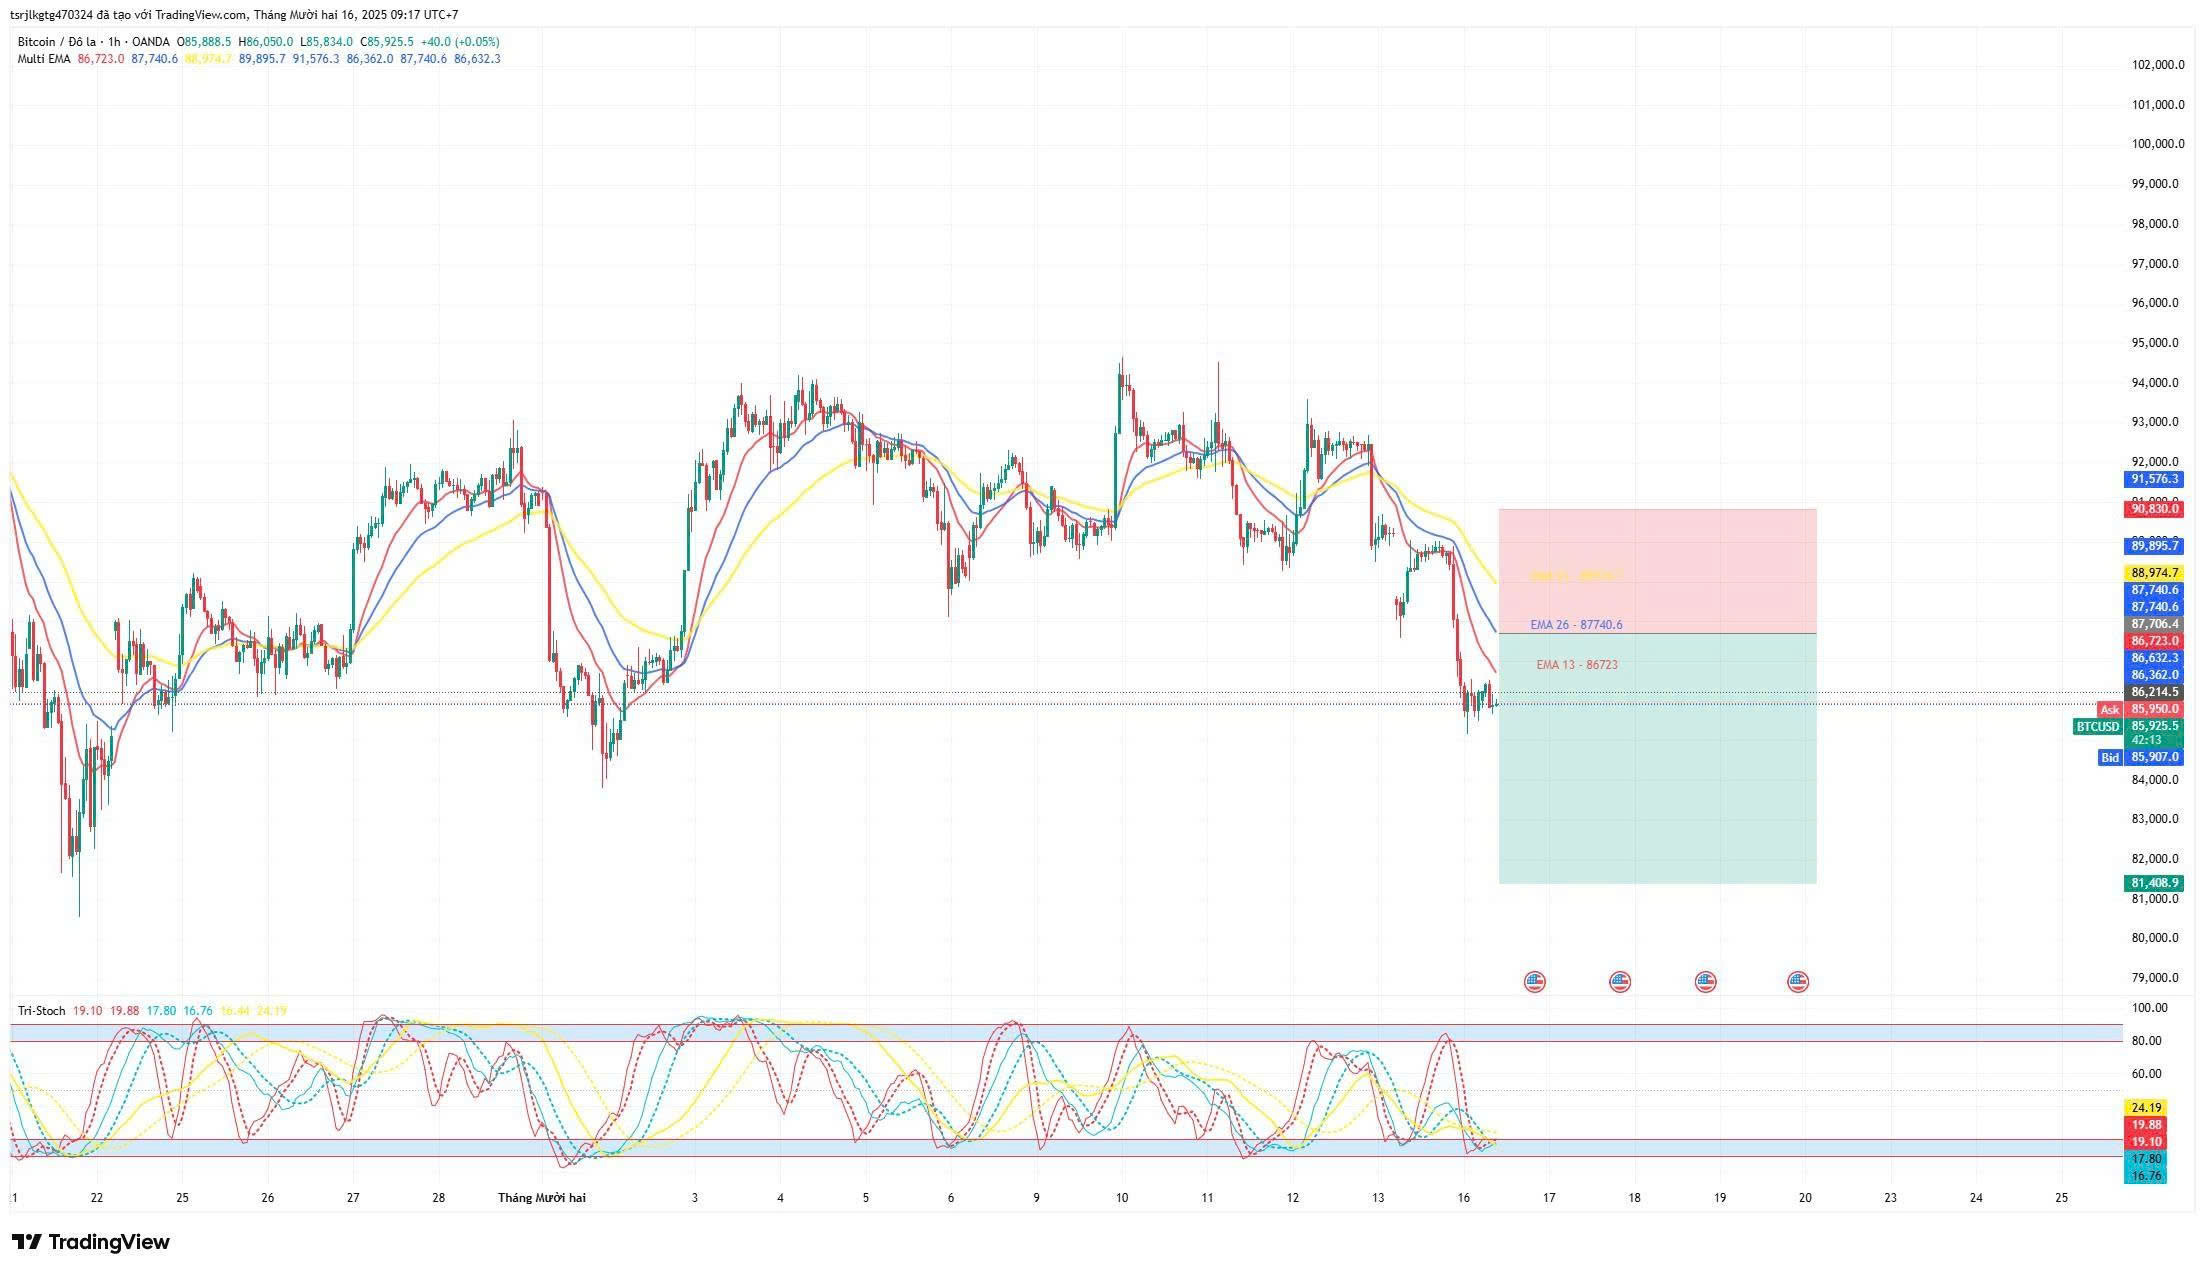
5. Crypto – BTC:
The worst-case scenario has unfolded: BTC has decisively broken below the $89,000 support level (ascending trendline) and plunged sharply to around $86,214. The current price structure is extremely weak, with price trading entirely below downward-expanding EMA lines, signaling strong selling pressure. Although the Stochastic indicator has entered oversold territory, this move resembles a “falling knife,” making bottom-fishing highly risky until a new price base is established.
TRADE OUTLOOK
1. BTC/USD
-
Sell at 87,600
-
Stop Loss: 90,800
-
Take Profit: 81,400
2. USD/CAD
-
Buy Stop at 1.38000
-
Stop Loss: 1.37300
-
Take Profit: 1.39300
KEY EVENTS TODAY
-
15:15 – EUR – Flash Manufacturing & Services PMI (France)
-
15:30 – EUR – Flash Manufacturing & Services PMI (Germany)
-
16:30 – GBP – Flash Manufacturing & Services PMI (UK)
-
(Tentative) – USD – ADP Employment Change
-
20:30 – USD – Average Hourly Earnings, Retail Sales, Core Retail Sales, Non-Farm Payrolls (NFP), Unemployment Rate
-
21:45 – USD – Flash Manufacturing & Services PMI (U.S.)
DISCLAIMER
-
The above analysis represents the personal views of analyst Jenny from Lotus and does not constitute a basis for real trading decisions.
-
Lotus provides technical analysis and trading education only.
-
Lotus does not represent any securities firm or asset management company.
-
Lotus does not manage client or student funds.

")


