 Lotus Institute


News
Lotus Institute
(1)_-13-08-2025-09-28-24.png)
Gold is facing a sharp decline in the near future.
Release Time: 10:00, August 13, 2025
Issuer: Mr. Tony
MARKET OVERVIEW
1. Stock Market:
-
Vietnam:
Trend: The market is in a strong and fairly sustainable uptrend, as shown by a continuous series of green candles and a clearly upward-sloping EMA. Each pullback is quickly bought up, indicating strong capital inflows into the market. Currently, the VN30 index is at a new all-time high, with no clear signs of weakening.
Key Resistance: 1,630 – 1,635: This is the current price range, also the newly formed historical peak. If 1,635 is decisively breached with high volume, the uptrend could extend toward 1,660 – 1,680. -
United States:
Trend: After a sharp decline in early August, the US30 has recovered, with the EMA starting to slope upward, suggesting a short-term bullish bias. However, the rebound is still weak compared to the previous decline, and prices are facing nearby resistance.
Resistance: 44,500 – 44,550: The recent rebound high; breaking above this could open the way to 44,900 – 45,000.
Support: 44,250 – 44,300: Near-term support (EMA).
43,900 – 44,000: Stronger support, the bottom of the previous pullback.
Short-term bias is bullish, but a breakout above 44,550 is needed to confirm a stronger trend; if 44,250 breaks, a return to 44,000 is likely.
2. Forex:
-
EUR/USD
Trend: Short-term uptrend after a strong rebound from the early-month low, with EMA pointing upward, but facing nearby resistance.
Resistance: 1.1710 – 1.1720 and 1.1780 – 1.1800.
Support: 1.1640 – 1.1650 (near EMA), followed by 1.1580 – 1.1600. -
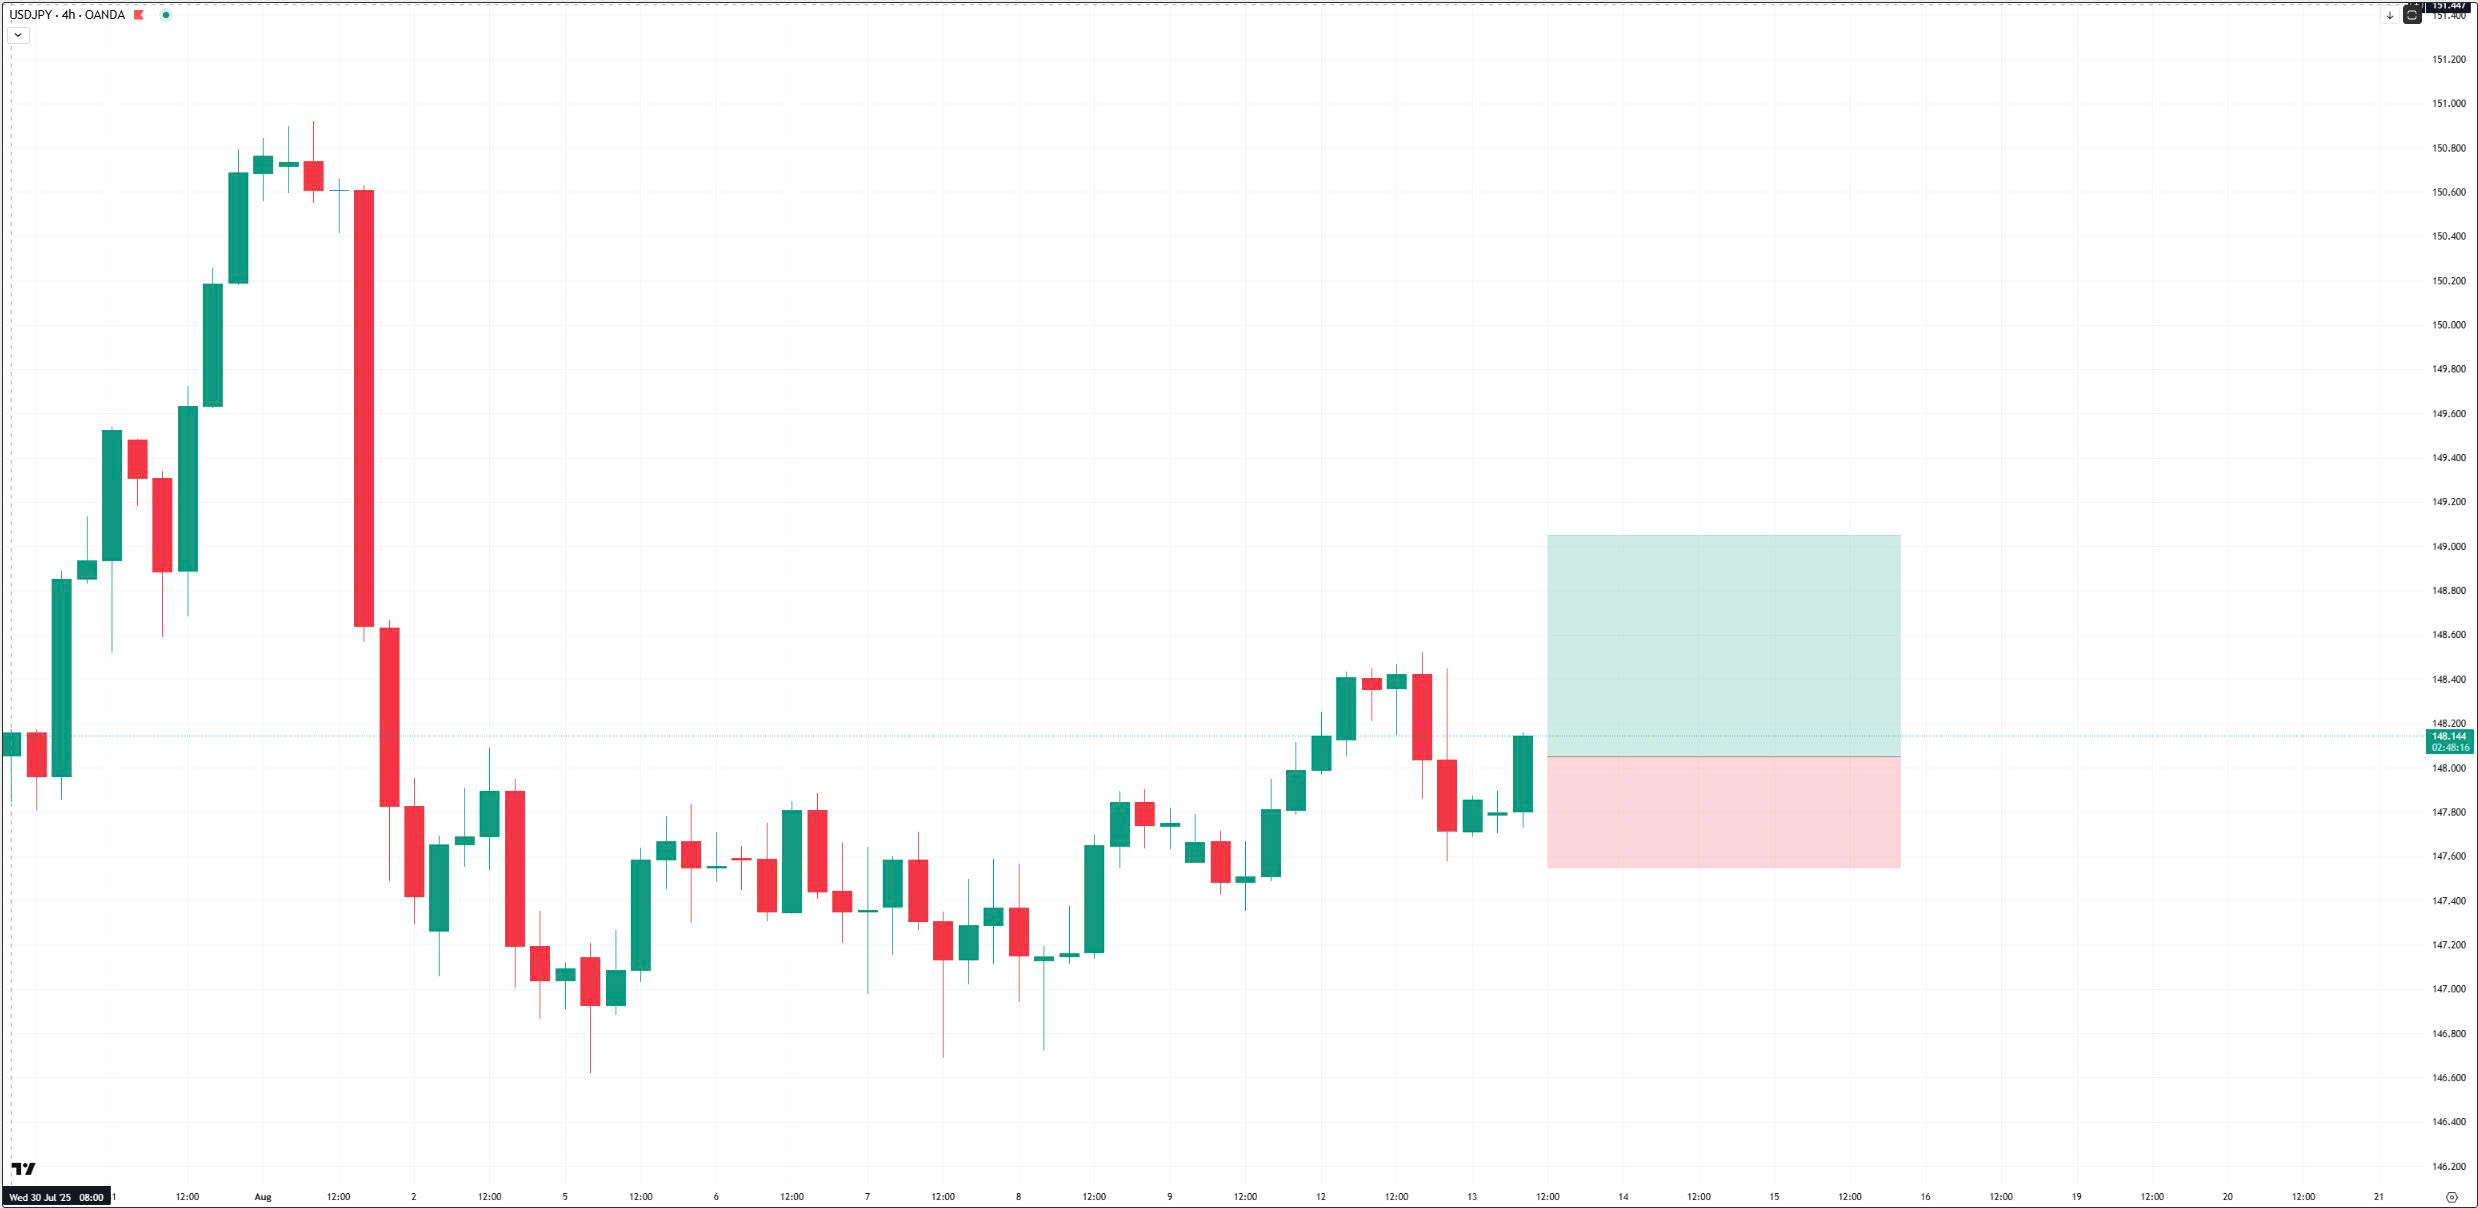
USD/JPY
Trend: Short-term sideways after a sharp drop from the early-month high; EMA is relatively flat, showing no clear trend.
Resistance: 148.8 – 149.0, and stronger at 150.8 – 151.0.
Support: 147.4 – 147.6, followed by 146.6 – 146.8.
3. Gold:
Trend: Short-term downtrend, with prices consolidating after a decline; EMA still pointing downward.
Resistance: 3,400 – 3,405 and 3,440 – 3,445.
Support: 3,340 – 3,345 and 3,300 – 3,305 (stronger), deeper at 3,260.
4. Oil:
Trend: Strong downtrend, with EMA sloping clearly downward; no reversal signals yet, and prices are at a new low.
Resistance: 63.8 – 64.0 (near EMA), followed by 66.0 – 66.2.
Support: 62.5 – 62.7 (near current low), deeper at 61.8 – 62.0.
5. Crypto:
Trend: Short-term uptrend after breaking the previous downtrend, with EMA pointing upward, but prices are stalling at resistance.
Resistance: 120,800 – 121,000, and stronger at 121,800 – 122,000.
Support: 119,000 – 119,200 (near EMA), followed by 117,800 – 118,000.
TRADE IDEA
-
USD/JPY
-
Trend: Bullish
-
Buy at 148.050, stop loss 147.550, take profit 149.050
-
KEY EVENTS TODAY
1:00 AM – USD
Federal Budget Balance
Actual: -291.1B | Forecast: -206.7B | Previous: 27.0B
3:30 AM – USD
API Weekly Statistical Bulletin
6:50 AM – JPY
Producer Price Index (PPI) y/y
Actual: 2.6% | Forecast: 2.5% | Previous: 2.9%
8:30 AM – AUD
Wage Price Index q/q
Actual: 0.8% | Forecast: 0.8% | Previous: 0.9%
1:00 PM – EUR
German Final CPI m/m
Actual: 0.3% | Forecast: 0.3%
EUR
German WPI m/m
Actual: 0.2% | Forecast: 0.2%
JPY
Prelim Machine Tool Orders y/y
Actual: -0.5%
(Time Unspecified) – CNY
New Loans
Actual: 305B | Forecast: 2240B
M2 Money Supply y/y
Actual: 8.3% | Forecast: 8.3%
(Time Unspecified) – EUR
German 10-year Bond Auction
Result: 2.62 | Bid-to-cover ratio: 1.5
7:00 PM – USD
FOMC Member Barkin Speaks
9:30 PM – USD
Crude Oil Inventories
Actual: -0.9M | Forecast: -3.0M
DISCLAIMER
-
The above analysis reflects only the personal views of analyst Tony from Lotus and is not a basis for actual market participation.
-
Lotus only provides technical trading analysis and trading education for students.
-
Lotus does not represent any securities company or asset management company.
-
Lotus does not manage students’ funds.


")

