 Lotus Institute


News
Lotus Institute
_-15-12-2025-09-28-51.png)
TECH STOCKS SELL-OFF - GOLD COOLS DOWN TO $4,322: A BUYING OPPORTUNITY?
Release Time: 10:00, December 15, 2025 Issuer: Mr. Leon
MARKET OVERVIEW
1. Stock Market:
-
Vietnam Market: The market continued its sharp decline, retreating below the 1,650 zone, with increased liquidity indicating clearly rising selling pressure after three consecutive sessions of correction. Although the MA100 remains a key support zone, the rapid pace of the decline has made this level precarious and it may continue to be tested in early-week sessions. The next support threshold is the 1,610 zone – which previously helped the market recover in November 2025. The market is expected to potentially retreat to this area before finding balance and retesting the support capability of the MA100.
-
US Market: In the Dec 12 session, the US market corrected after hitting historical highs, with the S&P 500 falling approximately 1.07% to 6,827.41 points, the Nasdaq Composite plunging ~1.69% to ~23,195.17 points, and the Dow Jones Industrial Average sliding ~0.51% to ~48,458.05 points due to sell-off pressure in the technology sector, specifically Broadcom and major AI stocks. This decline reflects more cautious investor sentiment and capital rotation into other stock groups.
2. Forex:
-
EUR/USD: Dominant trend is Sideways. Daily resistance: 1.17500; Daily support: 1.17300. Consider Long positions if price breaks the daily resistance zone.
-
USD/CAD: Dominant trend is Bullish. Daily resistance: 1.37900; Daily support: 1.37500. Consider Long positions if price breaks the daily resistance zone.
3. Gold:
-
After a vertical rally to the peak of $4,350, Gold is entering a Correction phase and cooling down to around the $4,322 mark.
-
The Bullish structure remains very solid. Two important Demand zones have been identified at $4,280 - $4,290 and $4,270. If the price holds these levels... (text cuts off, implied: it is a buying opportunity).
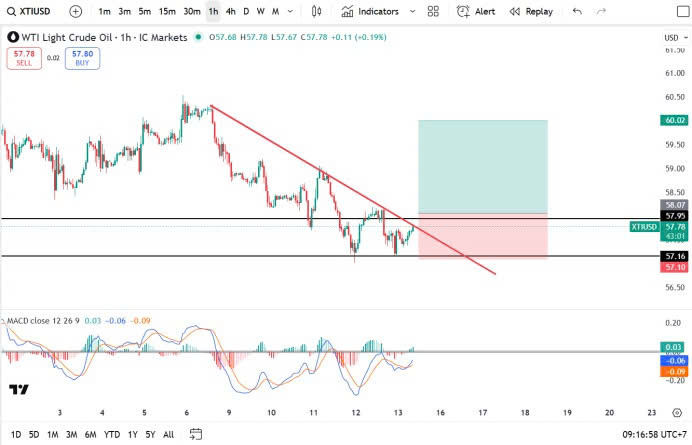
4. Oil:
-
XTI/USD: Dominant trend is Bearish. Daily resistance: 57.90; Daily support: 57.20. Consider Long positions if price breaks the daily resistance zone.
5. Bitcoin: BTC is trading at $89,327, moving close to the bullish trendline (blue line) which acts as the final dynamic support. Above, the $92,000 - $93,000 resistance zone is weighing heavily on the price. BTC is trapped in an ascending triangle pattern. Warning: If the trendline (region of $89k) is broken, the price could slide deeply; conversely, a strong rebound is needed to break this uncomfortable sideways stance.
RECOMMENDATIONS:
1. XTI/USD:
-
Buy Stop: 58.00
-
Stop Loss: 57.10
-
Take Profit: 60.00
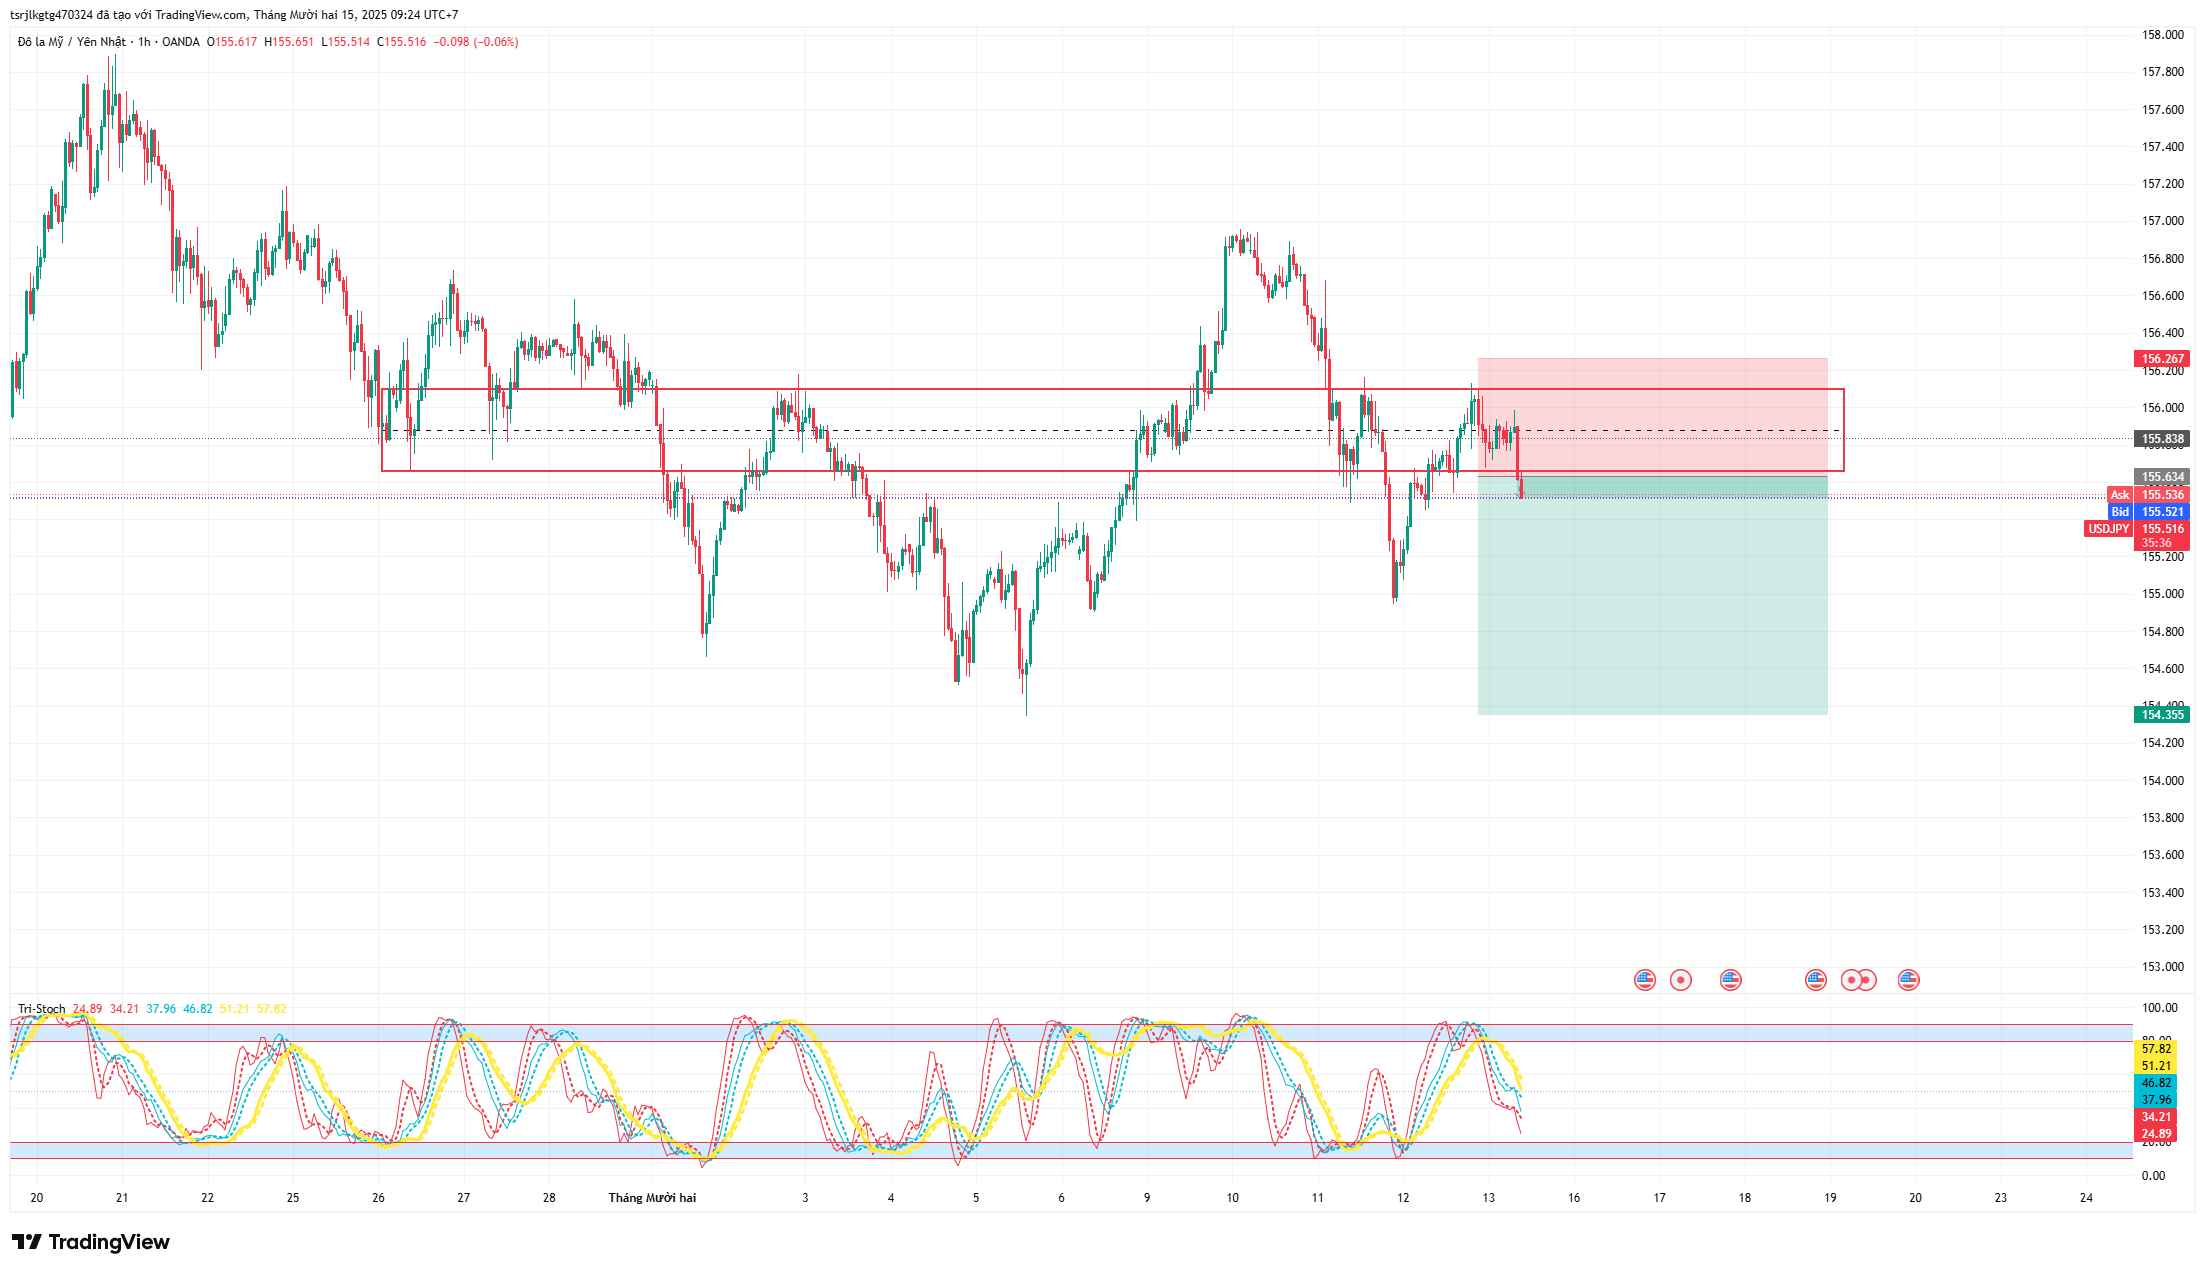
2. USD/JPY:
-
Recommendation: Sell at 155.529
-
Stop Loss: 156.267
-
Take Profit: 154.355
NOTABLE EVENTS TODAY: No significant news.
DISCLAIMER:
-
The above analysis represents the personal views of analyst Leon from Lotus and does not constitute a basis for actual market participation.
-
Lotus only provides technical trading analysis and trading knowledge training for students.
-
Lotus does not represent any securities company or asset management firm.
-
Lotus does not accept capital management for students.

")


